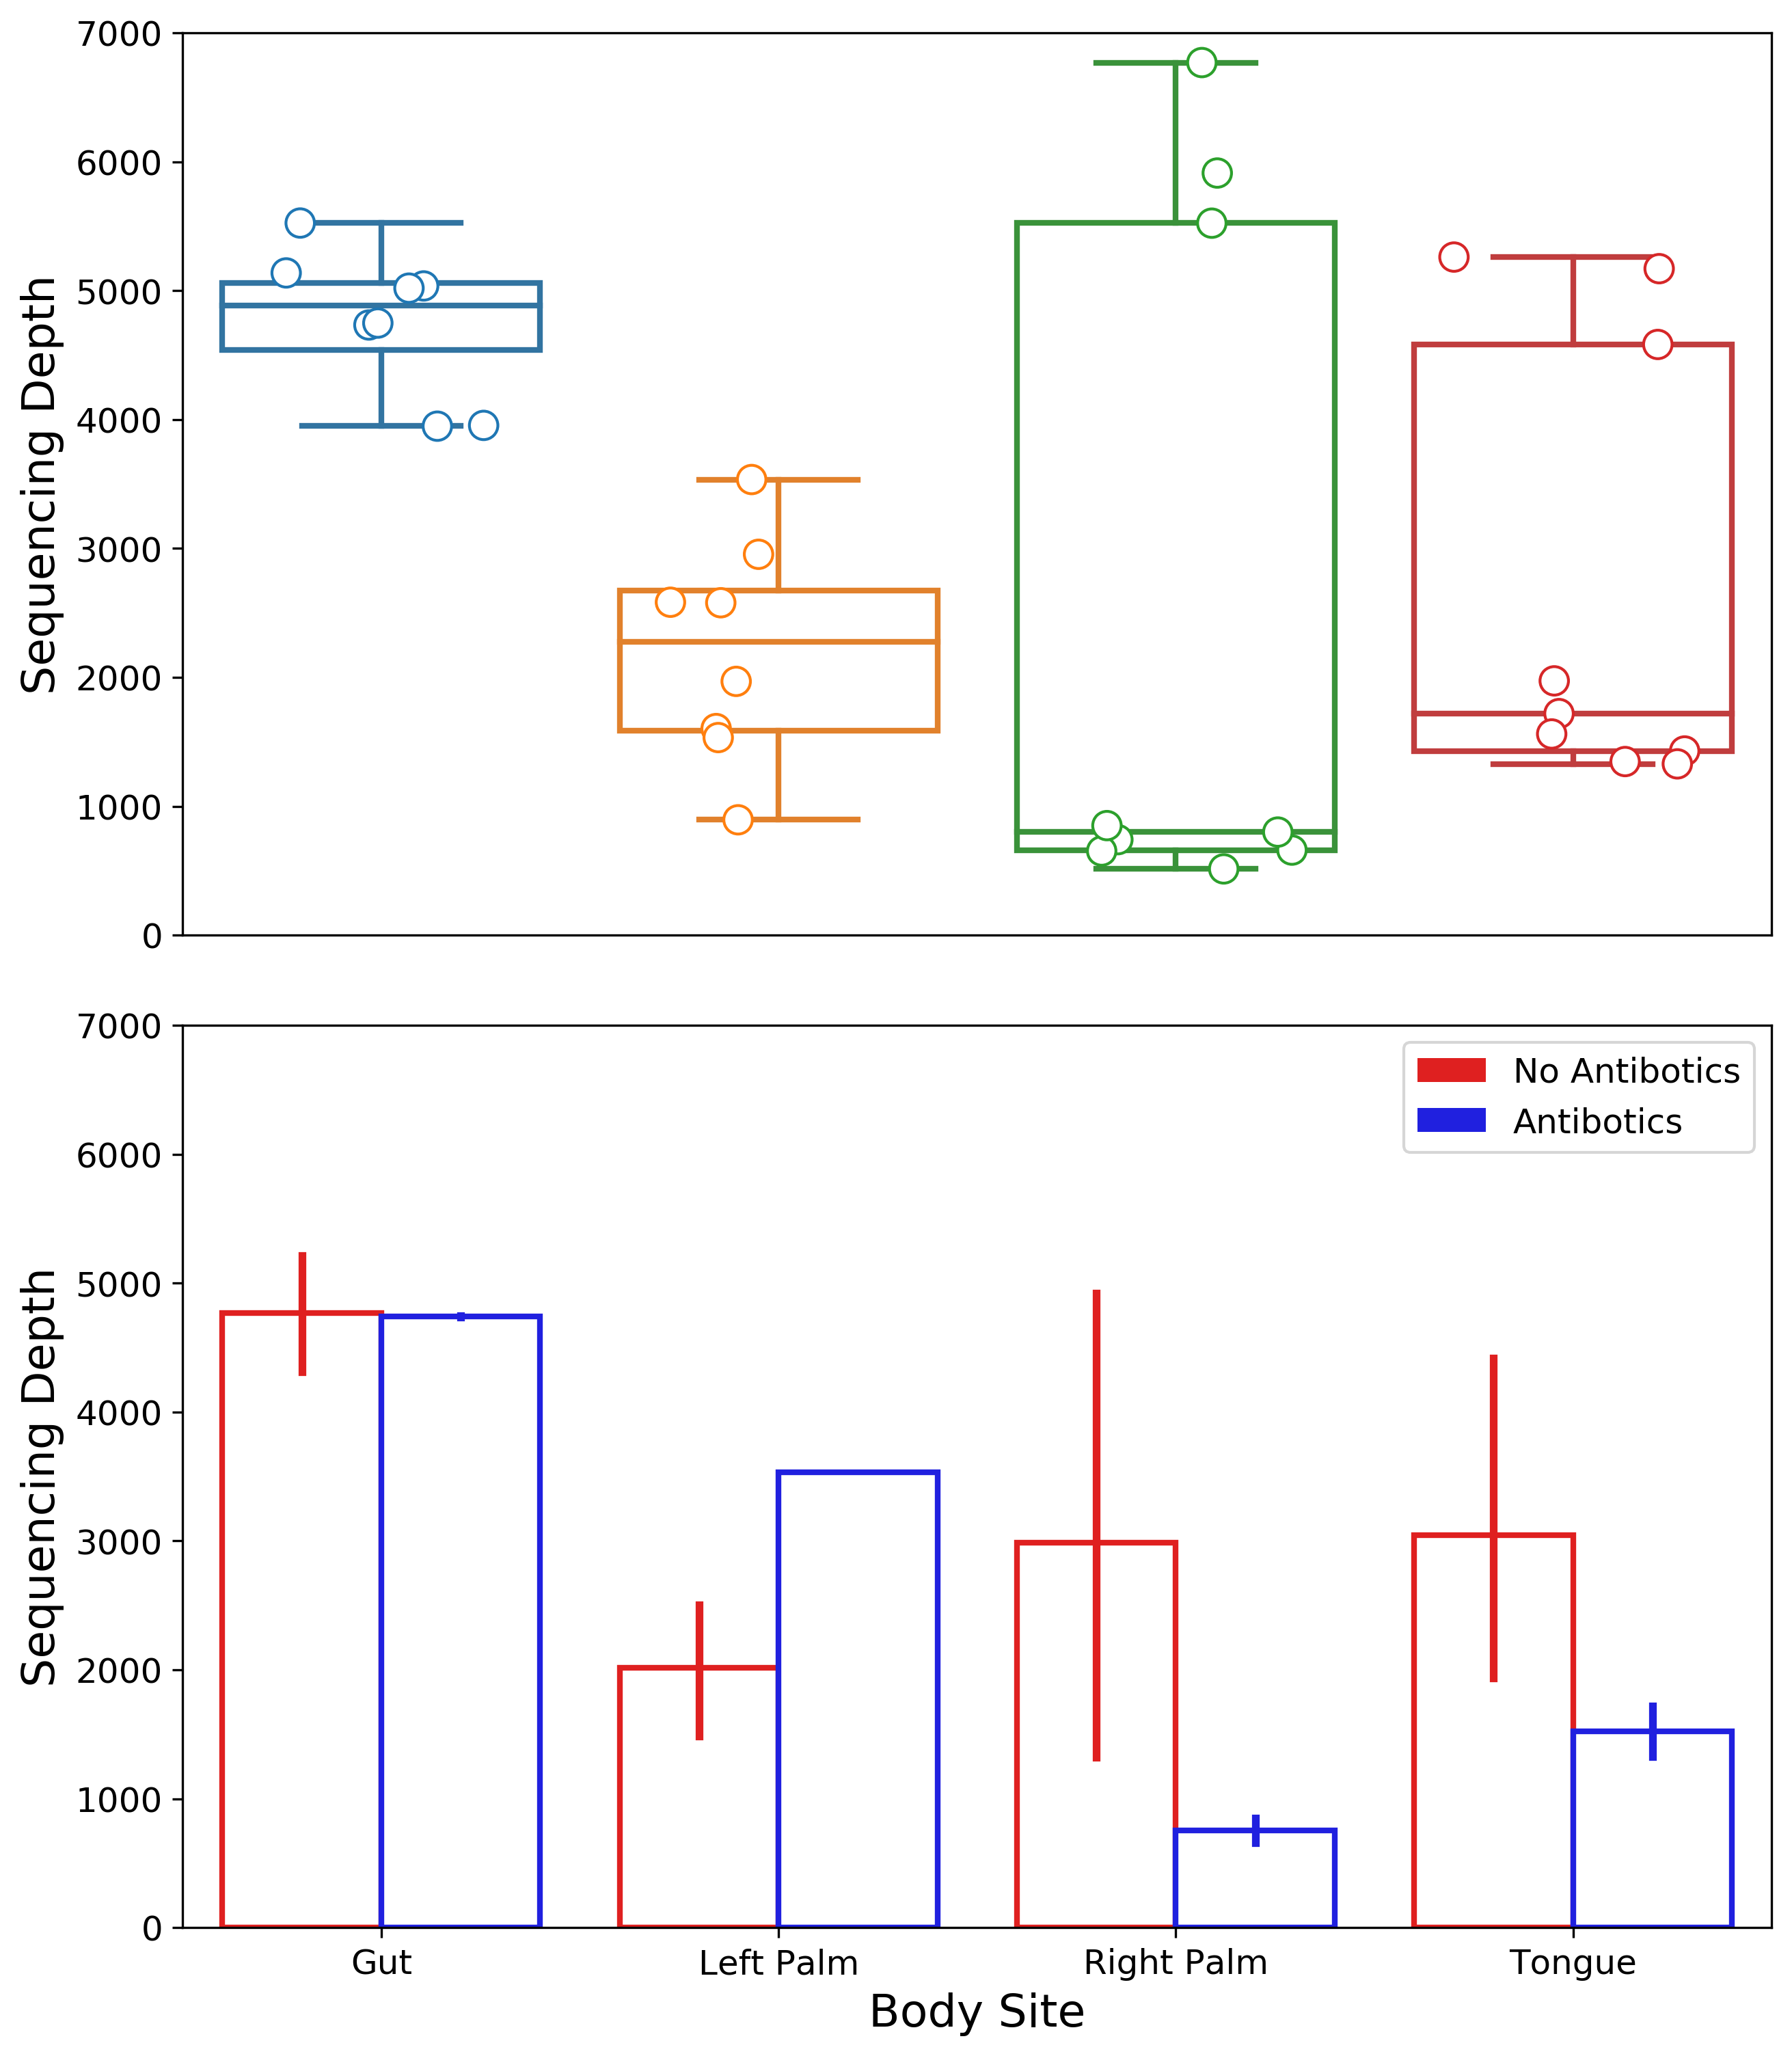
Recently a collaborator of mine asked that I edit one of my figures such that the inside of the boxplot was white but the outsides were colored corresponding to their respective categories. The inverse of this is straightforward: use sns.boxplot and set the hue parameter to the data category of interest. However, the inverse is a bit harder because there is no edge_hue option - there is only a single edgecolor parameter available to change in the seaborn API. It took some Googling but I figured out how to solve this task.
I came across this StackOverflow answer that served as the jumping-off point for this snippet. The basic premise is to plot the data “normally” (with the hue option) and then iterate through the components of the figure that need to be changed. What this component is called depends on the type of plot: points are collections, boxplots are artists, etc. It is also worth noting that visualizations featuring extra lines (such as the whiskers in a boxplot or the error bars in a barplot) must also be changed this way.
import matplotlib.pyplot as plt
import pandas as pd
from qiime2 import Artifact
import seaborn as sns

table = Artifact.load("../data/table-deblur.qza")
table_df = table.view(pd.DataFrame)
meta = pd.read_csv(
    "../data/sample-metadata.tsv",
    sep="\t",
    skiprows=[1],
    index_col=0,
)

depths = table_df.sum(axis=1).to_frame()
depths = depths.rename(columns={0: "depth"})
meta = meta.join(depths)

body_sites = sorted(meta["body-site"].unique())
fig, axs = plt.subplots(2, 1, figsize=(10, 12), sharex=True)
plt.subplots_adjust(hspace=0.1)

sns.boxplot(
    data=meta,
    x="body-site",
    order=body_sites,
    y="depth",
    linewidth=2,
    ax=axs[0],
)

sns.stripplot(
    data=meta,
    x="body-site",
    order=body_sites,
    y="depth",
    s=10,
    linewidth=1,
    jitter=0.3,
    ax=axs[0],
)

# adapted from https://tinyurl.com/y5cvdnbp
# box lines
for i, box in enumerate(axs[0].artists):
    color = box.get_facecolor()
    box.set_edgecolor(color)
    box.set_facecolor("white")

    # iterate over whiskers and median lines
    for j in range(6*i, 6*(i+1)):
        axs[0].lines[j].set_color(color)

# scatter points
for coll in axs[0].collections:
    color = coll.get_facecolor()
    coll.set_edgecolor(color)
    coll.set_facecolor("white")

sns.barplot(
    data=meta,
    x="body-site",
    order=body_sites,
    y="depth",
    hue="reported-antibiotic-usage",
    hue_order=["No", "Yes"],
    palette={"No": "red", "Yes": "blue"},
    linewidth=2,
    ax=axs[1],
)

handles, labels = axs[1].get_legend_handles_labels()
axs[1].legend(
    handles,
    ["No Antibotics", "Antibotics"],
    loc="upper right",
    fontsize=12,
)

# barplots & error bars
for patch, line in zip(axs[1].patches, axs[1].lines):
    color = patch.get_facecolor()
    patch.set_edgecolor(color)
    patch.set_facecolor("white")
    line.set_color(color)

for ax in axs:
    ax.set_ylim([0, 7000])
    ax.set_ylabel("Sequencing Depth", fontsize=16)
    ax.tick_params("y", labelsize=12)

axs[0].xaxis.set_visible(False)
axs[1].set_xticklabels([x.title() for x in body_sites], fontsize=12)
axs[1].set_xlabel("Body Site", fontsize=16)

plt.savefig("vbl_edge_colors.png", dpi=300, bbox_inches="tight")